Lab 03: Lift and Drag on Airfoils
AE 315 · Experimental Aerodynamics · Spring 2025 · ERAU
Experiment Overview
The NACA 4412 is a classic cambered airfoil used on general aviation aircraft. This lab measured its real aerodynamic performance across a range of angles of attack, then compared those measurements against ideal potential-flow predictions. The gap between theory and experiment directly quantifies the performance penalty of viscosity: the reason every real wing produces less lift and more drag than inviscid models predict — a trade-off designers must account for from the earliest stages of wing design.
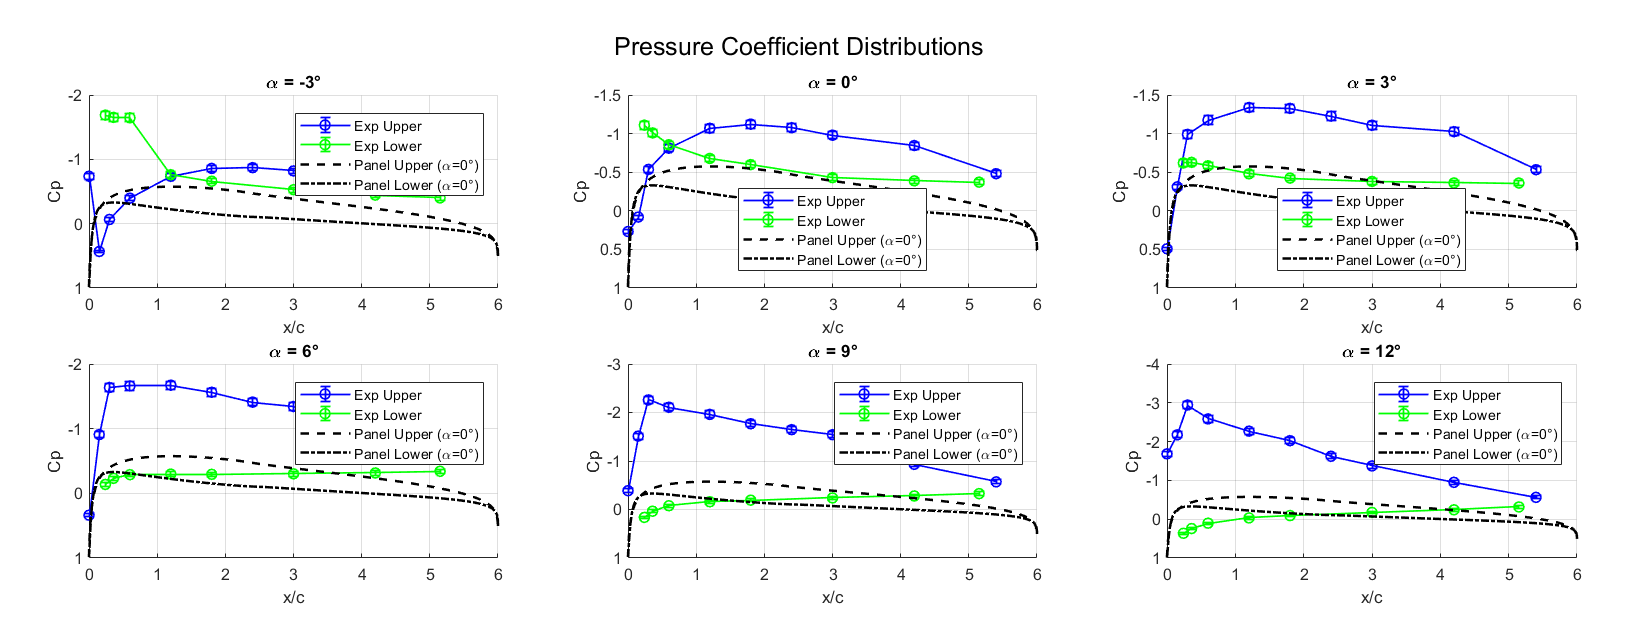
- Map the pressure distribution across 18 static taps on the NACA 4412 at angles of attack from −3° to 12°
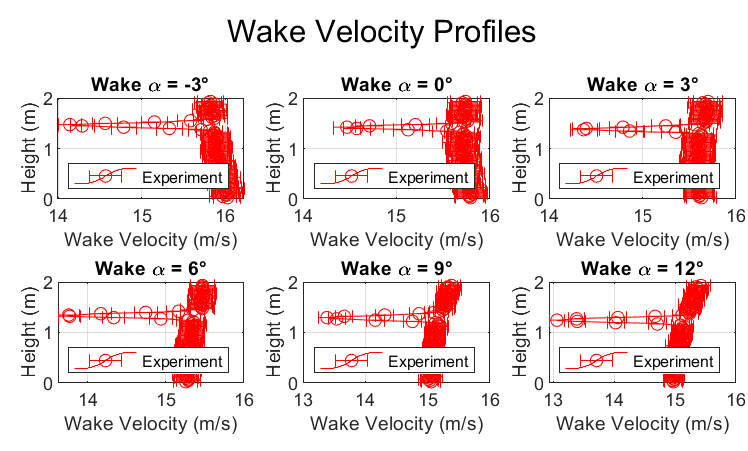
- Conduct a wake survey with a traversing pitot tube to compute drag from the momentum deficit downstream
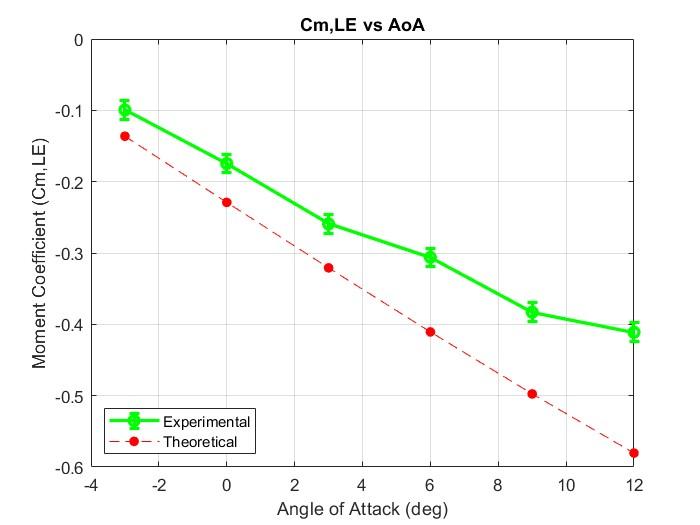
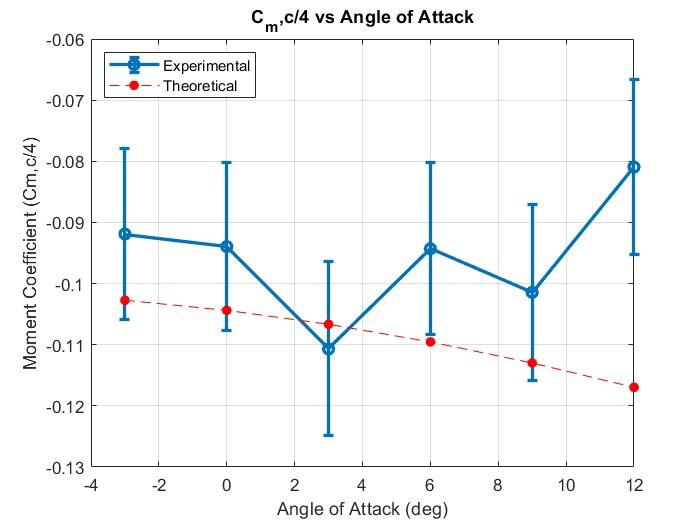
- Extract lift coefficient Cl, drag coefficient Cd, and moment coefficients Cm,LE and Cm,c/4
- Determine the zero-lift angle of attack and identify the most aerodynamically efficient operating point
Equipment & Tools
- ERAU open-circuit wind tunnel (15 m/s test speed)
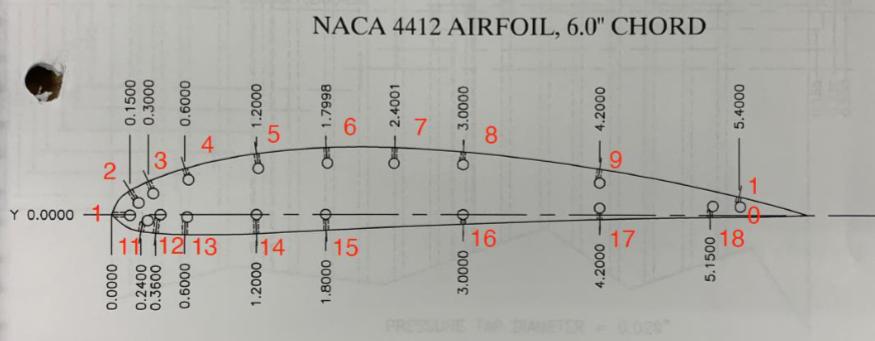
- NACA 4412 airfoil model, 6-inch chord, with 18 static pressure taps (10 upper, 8 lower)
- Traversing pitot-static wake probe (76 height positions)
- Differential pressure transducers and data acquisition system
- Panel code reference data (PanelCode.mat) for potential-flow comparison
- MATLAB/Simulink for data processing and aerodynamic coefficient integration
Approach & Key Equations
At 15 m/s, the 18 surface pressure taps sampled the pressure distribution simultaneously at each angle of attack while a traversing probe swept 76 heights through the downstream wake. Lift was obtained by integrating the pressure difference between the lower and upper surfaces along the chord:
Cl = (1/c) ∫LETE (Cp,lower − Cp,upper) dx
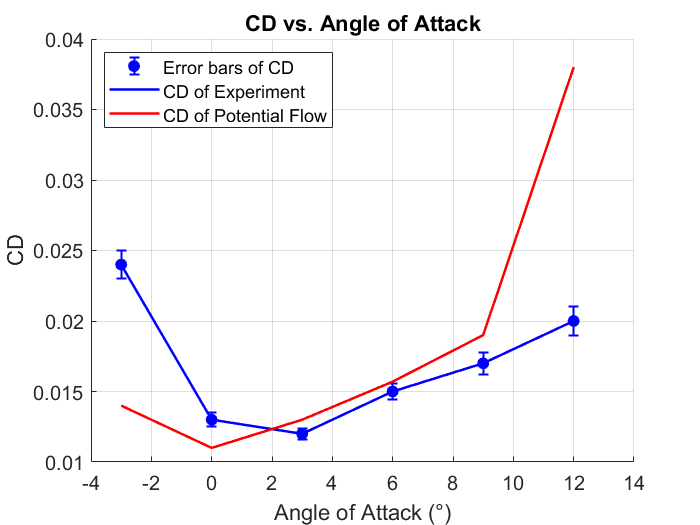
Drag was derived from the wake momentum deficit — a method that captures viscous drag directly from the velocity profile downstream and requires no physical force sensor. Pitching moments about both the leading edge and quarter-chord were integrated from the same pressure data, and all results were compared against panel code (potential flow) predictions.
Key Results
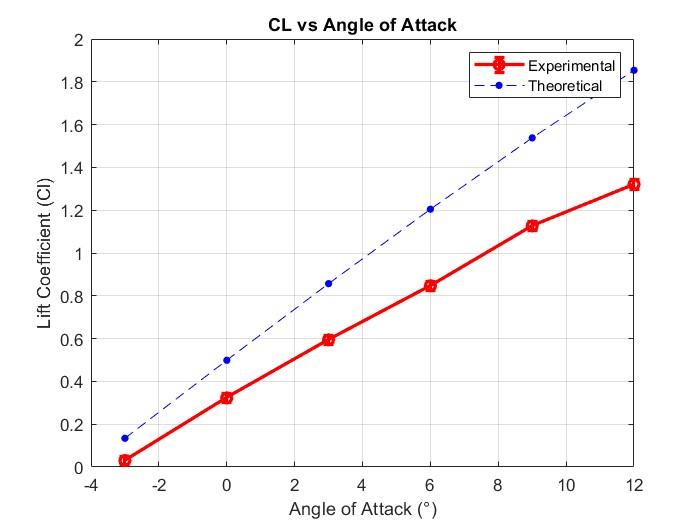
- Cl increased linearly with angle of attack but remained consistently below the potential-flow prediction — quantifying the lift penalty from viscous skin friction in a real flow.
- Cm,LE became progressively more negative with angle of attack (stronger nose-down pitching moment), while Cm,c/4 stayed approximately constant near −0.09, confirming the quarter-chord as the aerodynamic center for this airfoil.
- Zero-lift angle of attack = −3.31°, extrapolated from the experimental Cl vs α curve — consistent with theory for a positively cambered airfoil.
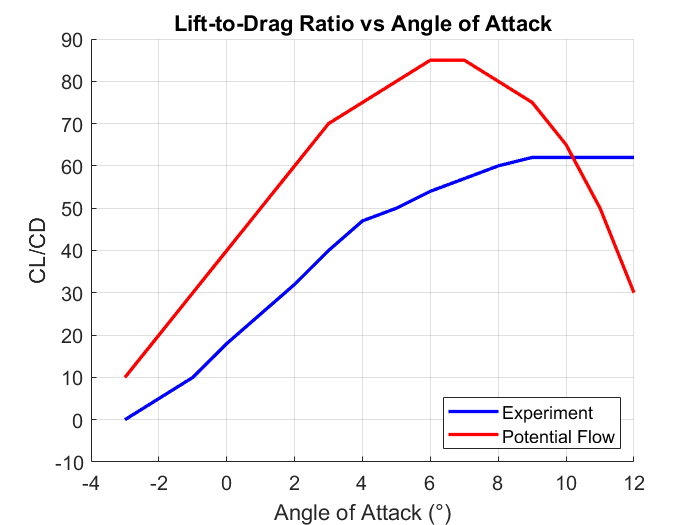
- Peak L/D ratio occurred near 9° AoA, identifying the most aerodynamically efficient operating point for the NACA 4412 at this Reynolds number.
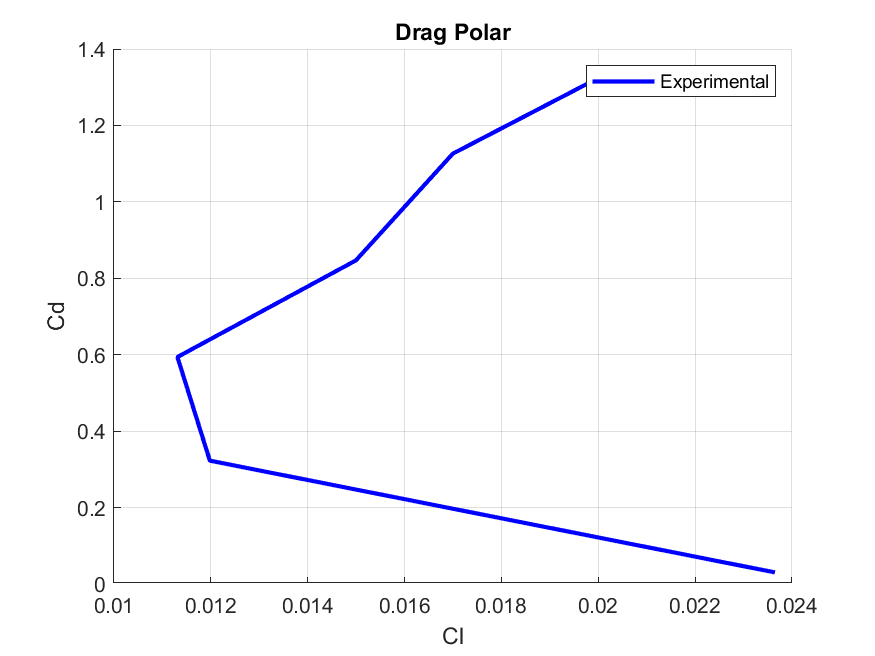
- The drag polar was bowl-shaped rather than the ideal fishhook shape, partly attributable to elevated drag at −3° from a larger-than-intended setup angle.
MATLAB Code
Surface pressure and wake traverse data were integrated to extract aerodynamic coefficients. The zero-lift angle was found by linear interpolation of the Cl–α curve through zero lift.
% Lift coefficient from pressure integration (lower - upper)
Cl(i) = trapz(lower_x, Cp_lower(i,:)) - trapz(upper_x, Cp_upper(i,:));

% Drag from wake momentum deficit
D(i)  = rho * trapz(z(i,:), Vel(i,:) .* (V_inf - Vel(i,:)));
Cd(i) = D(i) / (0.5 * rho * V_inf^2 * chord);

% Zero-lift angle of attack
alpha_0 = interp1(Cl, AoA_vals, 0, 'linear', 'extrap');  % = -3.31°
Valuable Takeaways
- Viscosity costs lift and adds drag — quantifiably. Plotting both experimental and theoretical Cl curves makes this performance penalty tangible, not just a textbook abstraction.
- The drag polar is one of the most information-rich plots in aerodynamics. Its shape encodes efficiency at every operating point, and reading it fluently is essential for wing design, glider optimization, and aircraft performance analysis.
- The wake momentum method is a powerful, hardware-independent drag measurement technique used in academic and industrial wind tunnel testing, including at NASA Langley and major airframe manufacturers.
- Gained end-to-end experience: raw pressure tap data → Cp distributions → integrated aerodynamic coefficients → validated polar curves — the same workflow used in real aerodynamic development programs.